Director's Blog: the latest from USPTO leadership

« USPTO Year in Review... | Blog homepage | Talking Quality »
Tuesday Sep 07, 2010

Greater Transparency: Introducing the USPTO Data Visualization Center and the Patents Dashboard

Blog by Under Secretary of Commerce for Intellectual Property and Director of the USPTO David Kappos

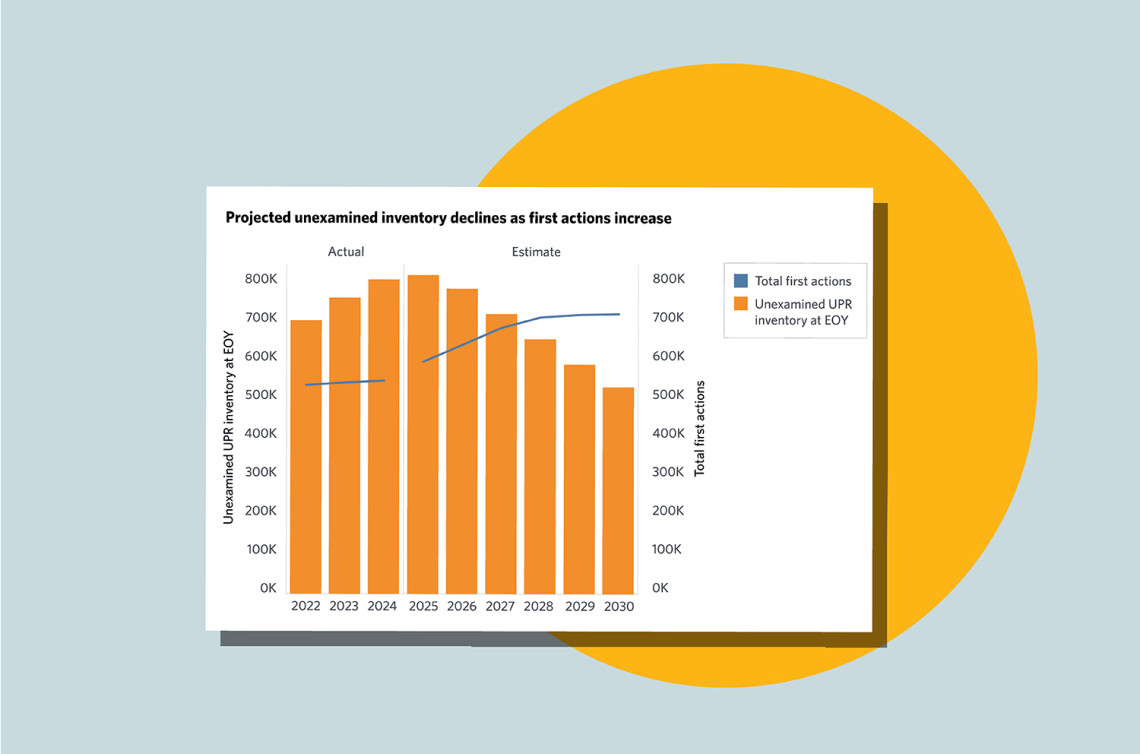
As you all know, reducing the backlog of unexamined patent applications and driving patent pendency down is our top priority.  This goal is especially urgent at a time when our economy is struggling, and the patent backlog is stalling the delivery of innovative goods and services to market while hindering economic growth and job creation.  It has been estimated that the current backlog of more than 700,000 applications may cost the U.S. economy billions of dollars due to what is called “foregone innovation”— commercial opportunities that fail to get off the ground because of long delays in obtaining necessary patent protection.  That is unacceptable and we are determined to turn things around because so much depends on it.


An important part of the effort to reduce pendency is better understanding the numerous factors that contribute to examination delays and measuring their impact in a way that makes the USPTO more transparent to the public.  By looking at the whole picture, we can more effectively develop ways to increase the efficiency of the examination process.  While we know we have to hire more examiners to reduce the backlog, we also know that we must re-engineer the way we do business at the USPTO and have already implemented a series of initiatives designed to improve efficiencies.  These process changes will empower our workforce to be more effective and have already begun to yield important gains.


Traditionally, we have measured pendency at two points in the process:  first, we have measured the average time from filing to First Office Action, which is the first substantive examination action; and we have measured the average time from filing to allowance or abandonment of the application, which we refer to on the dashboard as Traditional Total Pendency.  We will continue to maintain these measures as they are helpful ways to look at pendency, and indeed sometimes the best measure for applications that proceed through the system without the need for appeals or divisional practice or continuation practice.  These traditional measures will also be maintained because they provide a consistent benchmark against which to measure our progress, and enable us to maintain consistency in our reporting to the Department of Commerce, the Office of Management and Budget, the Congress and the public.  However, as I have previously stated, these measures do not provide complete data about pendency across the USPTO.  We therefore will now measure pendency in several additional ways to ensure we have a more complete picture, and will make that data available to the public starting today. 


We have just launched the beta version of a USPTO Data Visualization Center on our Web site that introduces the patents dashboard.  This tool will give the public access to traditional measures of pendency as well as several new pendency tracking measures.  We are also providing other important data covering USPTO patent operations in a convenient dashboard format.  The patents dashboard provides more refined pendency information than was previously available, as well as other critical performance indicators such as the number of applications in the backlog, production, actions per disposal and our staffing levels.  This information will help the entire IP community to better understand our processes, and enable applicants to make more informed decisions about their applications, especially as we develop more opportunities for applicants to control the timing at which their applications are examined.  The new dashboard, which will be updated monthly, will also be used internally by the USPTO to analyze and improve our examination process and to track the effectiveness of our improvement efforts.  We intend to further refine the dashboard and welcome your input about ways we can improve it.  A dedicated mailbox has been set up for your comments and we intend to monitor your feedback carefully.  


The dashboard introduces six new measures of pendency designed to give a better overall picture of the contributions of different parts of the examination process to application pendency.  For example, the traditional total pendency measure stops the clock with the filing of an RCE, which may not provide an accurate measure of the total time it takes to complete the examination of an application through request for continued examination (RCE) practice.  A new measure, called “Traditional Total Pendency Including RCEs,” looks at pendency of applications from filing of the original application to ultimate disposal of that same application, including any additional time attributable to RCE filings in those applications where RCE filings are made.  Similar measures are provided relative to divisional applications and other types of continuation practice.  We also provide information about pendency for applications in appeal practice.


You can learn more about what we will be measuring and tracking on the dashboard at www.uspto.gov/dashboards.  For those who really want to dive into the numbers, we will also make a more detailed spreadsheet available for each measure with additional data.  We encourage you to watch our progress as the programs and initiatives we’ve started over the past year begin to show results.  For instance, you’ll see that the number of actions per disposal is dropping, indicating improved examination efficiency.  With the recent legislation giving us access to an additional $129 million of our collections, our ability to increase examiner overtime and accelerate information technology improvements and hiring will lead to even more progress in reducing application pendency and the backlog of unexamined applications.


We're pleased to offer a useful new tool for our stakeholders, and a window into our operations that has not been available before.  We hope you find the car dashboard metaphor helpful and attractive.  While we recognize that data visualization experts may prefer other formats, the dashboard metaphor conveys information succinctly, and gives us all something to start with.  However we appreciate that all metaphors have their limits -- for instance the speedometer format is certainly not intended to convey that a higher backlog is better.  


We hope you’ll find the new USPTO Data Visualization Center and dashboard to be a valuable resource and we welcome any feedback you have on how we can make it even better -- even as to the metaphor used to visualize the data we are presenting.


We look forward to your feedback.


Comments:

Very useful info. I would also like to see a gauge showing time from Notice of Appeal to a decision by the BPAI.

Posted by Louis Ventre on September 08, 2010 at 06:10 AM EDT #

Great tool! I would love to see PCT-related info as well. I have been using S. Korea as my ISA because of their speed based on data a few years old (seems to be taking a bit longer now). Would like to know recent data for the speed of completion of the ISR-WO (requested way before as well as at the 12 months from priority date) for the US ISA.

Posted by Paul Fordenbacher on September 22, 2010 at 10:40 AM EDT #

Post a Comment:
Comments are closed for this entry.