| CPC G06Q 10/0633 (2013.01) [G06F 9/54 (2013.01); G06T 3/40 (2013.01); G06T 11/206 (2013.01); G06T 2200/24 (2013.01)] | 20 Claims |
|
1. A method of rendering a user interface for the presentation of objects that are associated with a project, the method comprising:
by a workflow management system:
analyzing a plurality of electronic objects that are managed by a plurality of external applications during a time period, wherein each of the electronic objects corresponds to a unique event that occurred as part of one or more workstreams,
extracting metadata from each of the electronic objects,
computing hypergraph data from the metadata, in which:
the hypergraph data comprises a plurality of edges and a plurality of nodes that are associated with one or more of the edges;
each edge corresponds to one or more of the electronic objects; and
each node corresponds to an item that is associated with multiple objects of one or more of the workstreams over a time period,
saving the hypergraph data to a memory,
receiving a new electronic object,
assigning a category to the new electronic object,
determining whether the category corresponds one or more nodes of the hypergraph, and
when the category corresponds to a node, updating the hypergraph data by associating the new electronic object to an edge of the corresponding node; and
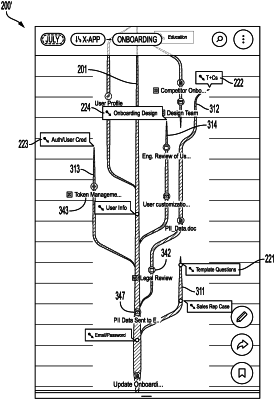
by a workflow presentation system, causing a display device to output a graphical user interface that outputs a visual representation of the hypergraph data by:
identifying a level of zoom to be displayed and a time frame,
accessing the hypergraph data and identifying a set of one or more nodes that are to be displayed at the level of zoom for the time frame,
causing the display device to display each identified node as a rail in a hypergraph,
for each identified node, determining which edges are to be displayed at the level of zoom, and
causing the display device to display, in the hypergraph, any edges that are to be displayed at the level of zoom.
|