| CPC G06F 17/18 (2013.01) [G06F 17/10 (2013.01)] | 3 Claims |

|
1. An adaptive method of cleaning structural health monitoring (SHM) data based on local outlier factor, comprising:
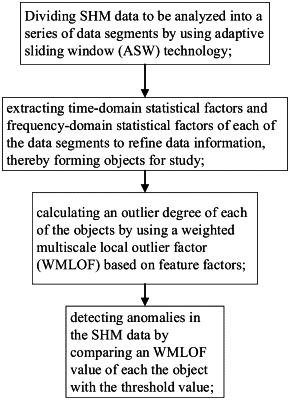
step 1: dividing SHM data to be analyzed into a series of data segments by using adaptive sliding window (ASW) technology;
wherein the step 1 comprises:
1) Dividing the SHM data to be analyzed by using a sliding window of mini-length W, and a value of the mini-length W being associated with a length of a signal to be analyzed; wherein a ratio of the mini-length of W to a length of the SHM data to be analyzed is in a range of 1/200 to 1/100;
2) Calculating a variance value of each of the data segments divided by the sliding window of the mini-length W;
3) Averaging the variance values of the data segments to obtain a mean value V, and taking the mean value V of the variance values of the data segments as a threshold value, wherein V=mean (Var1, Var2, Varn), where mean represents an average operation, n represents a number of the data segments, and Var represents the variance value;
4) Comparing the variance value of each of the data segments with the threshold value, and taking variance value features adjacent to the threshold value as anchor points of ASWs, wherein the variance value features correspond to an abnormal data development region Rin and an abnormal data decline region Rout respectively; and
5) Combining the anchor points of the ASWs in pairs to generate specific ASWs with different sizes, wherein data outside the abnormal data development region Rin and the abnormal data decline region Rout is regarded as normal data with a same attribute;
step 2: extracting time-domain statistical factors and frequency-domain statistical factors of each of the data segments to refine data information, thereby forming objects for study;
step 3: calculating an outlier degree of each of the objects by using a weighted multiscale local outlier factor (WMLOF) based on feature factors;
step 4: detecting anomalies in the SHM data by comparing an WMLOF value of each the object with the threshold value; and
step 5: eliminating data corresponding to the anomalies from the SHM data to obtain target SHM data, thereby performing fault diagnosis on mechanical equipment corresponding to the SHM data based on the target SHM data;
wherein in the step 3, the WMLOF is used to determine weights of local outlier factor (LOF) values under different nearest neighbors k, an entropy weight method (EWM) is used to perform weighting, and steps to calculate the weights are as follows:
step (i): determining an evaluation object matrix DT; wherein each row and column of the evaluation object matrix DT respectively represent an evaluation object and a LOF original feature corresponding to the evaluation object; in the evaluation object matrix DT, [p=1, 2, . . . , n; k=kmin, kmin+1, . . . , kmax−1, kmax]; n represents a number of the evaluation object; k∈[kmin, kmax], kmin and kmax are 5 and 20 respectively;
 step (ii): using normalization of indexes to normalize heterogeneous indexes, and using a linear normalization technique to render dataset of the evaluation object matrix DT dimensionless, thereby obtaining a NDMpk matrix through the following formula:
 wherein qpk represents data of the evaluation object matrix DT corresponding to an evaluation object p under a k-th nearest neighbor, and qk represents data of the evaluation object matrix DT under the k-th nearest neighbor;
step (iii): obtaining an occurrence probability of a response Prpk and calculating an entropy value of the response Prpk by the following formulas:
 wherein Enk represents the entropy value, and e represents a natural logarithm;
step (iv): calculating an information entropy redundancy Divk of each the response Prpk and an entropy weight value Ewk of the information entropy redundancy Divk by the following formulas;
 wherein LOF results of each sample under the different nearest neighbors k are regarded as responses of different samples, and WMLOF of the evaluation object p is obtained by the following formula:
WMLOFp=100×Ew(NDMp)T
where Ew represents an entropy weight value, and T represents a transposition operation.
|